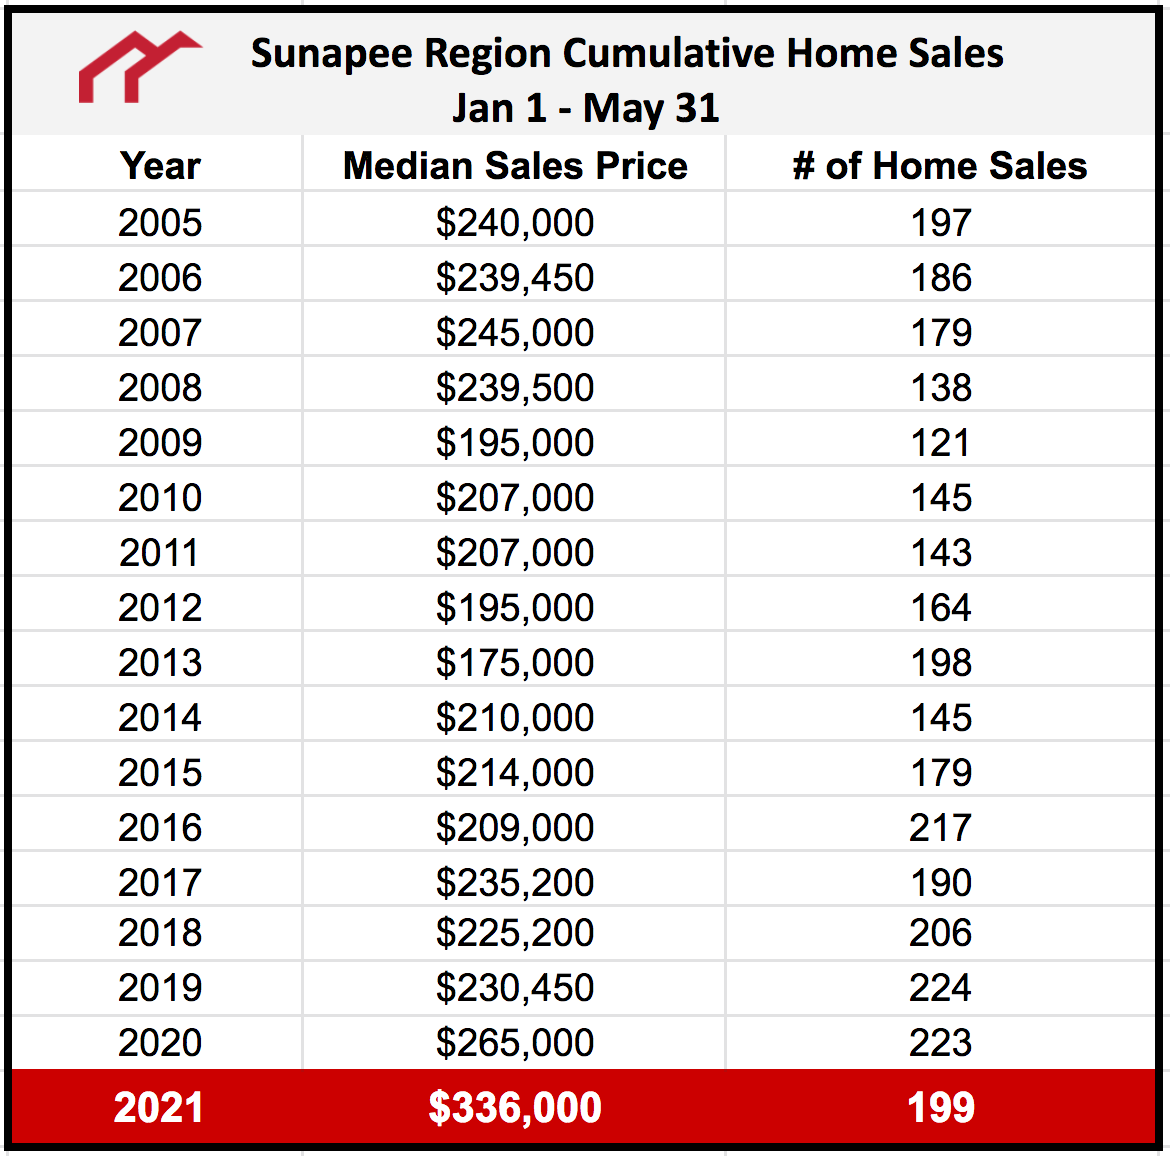
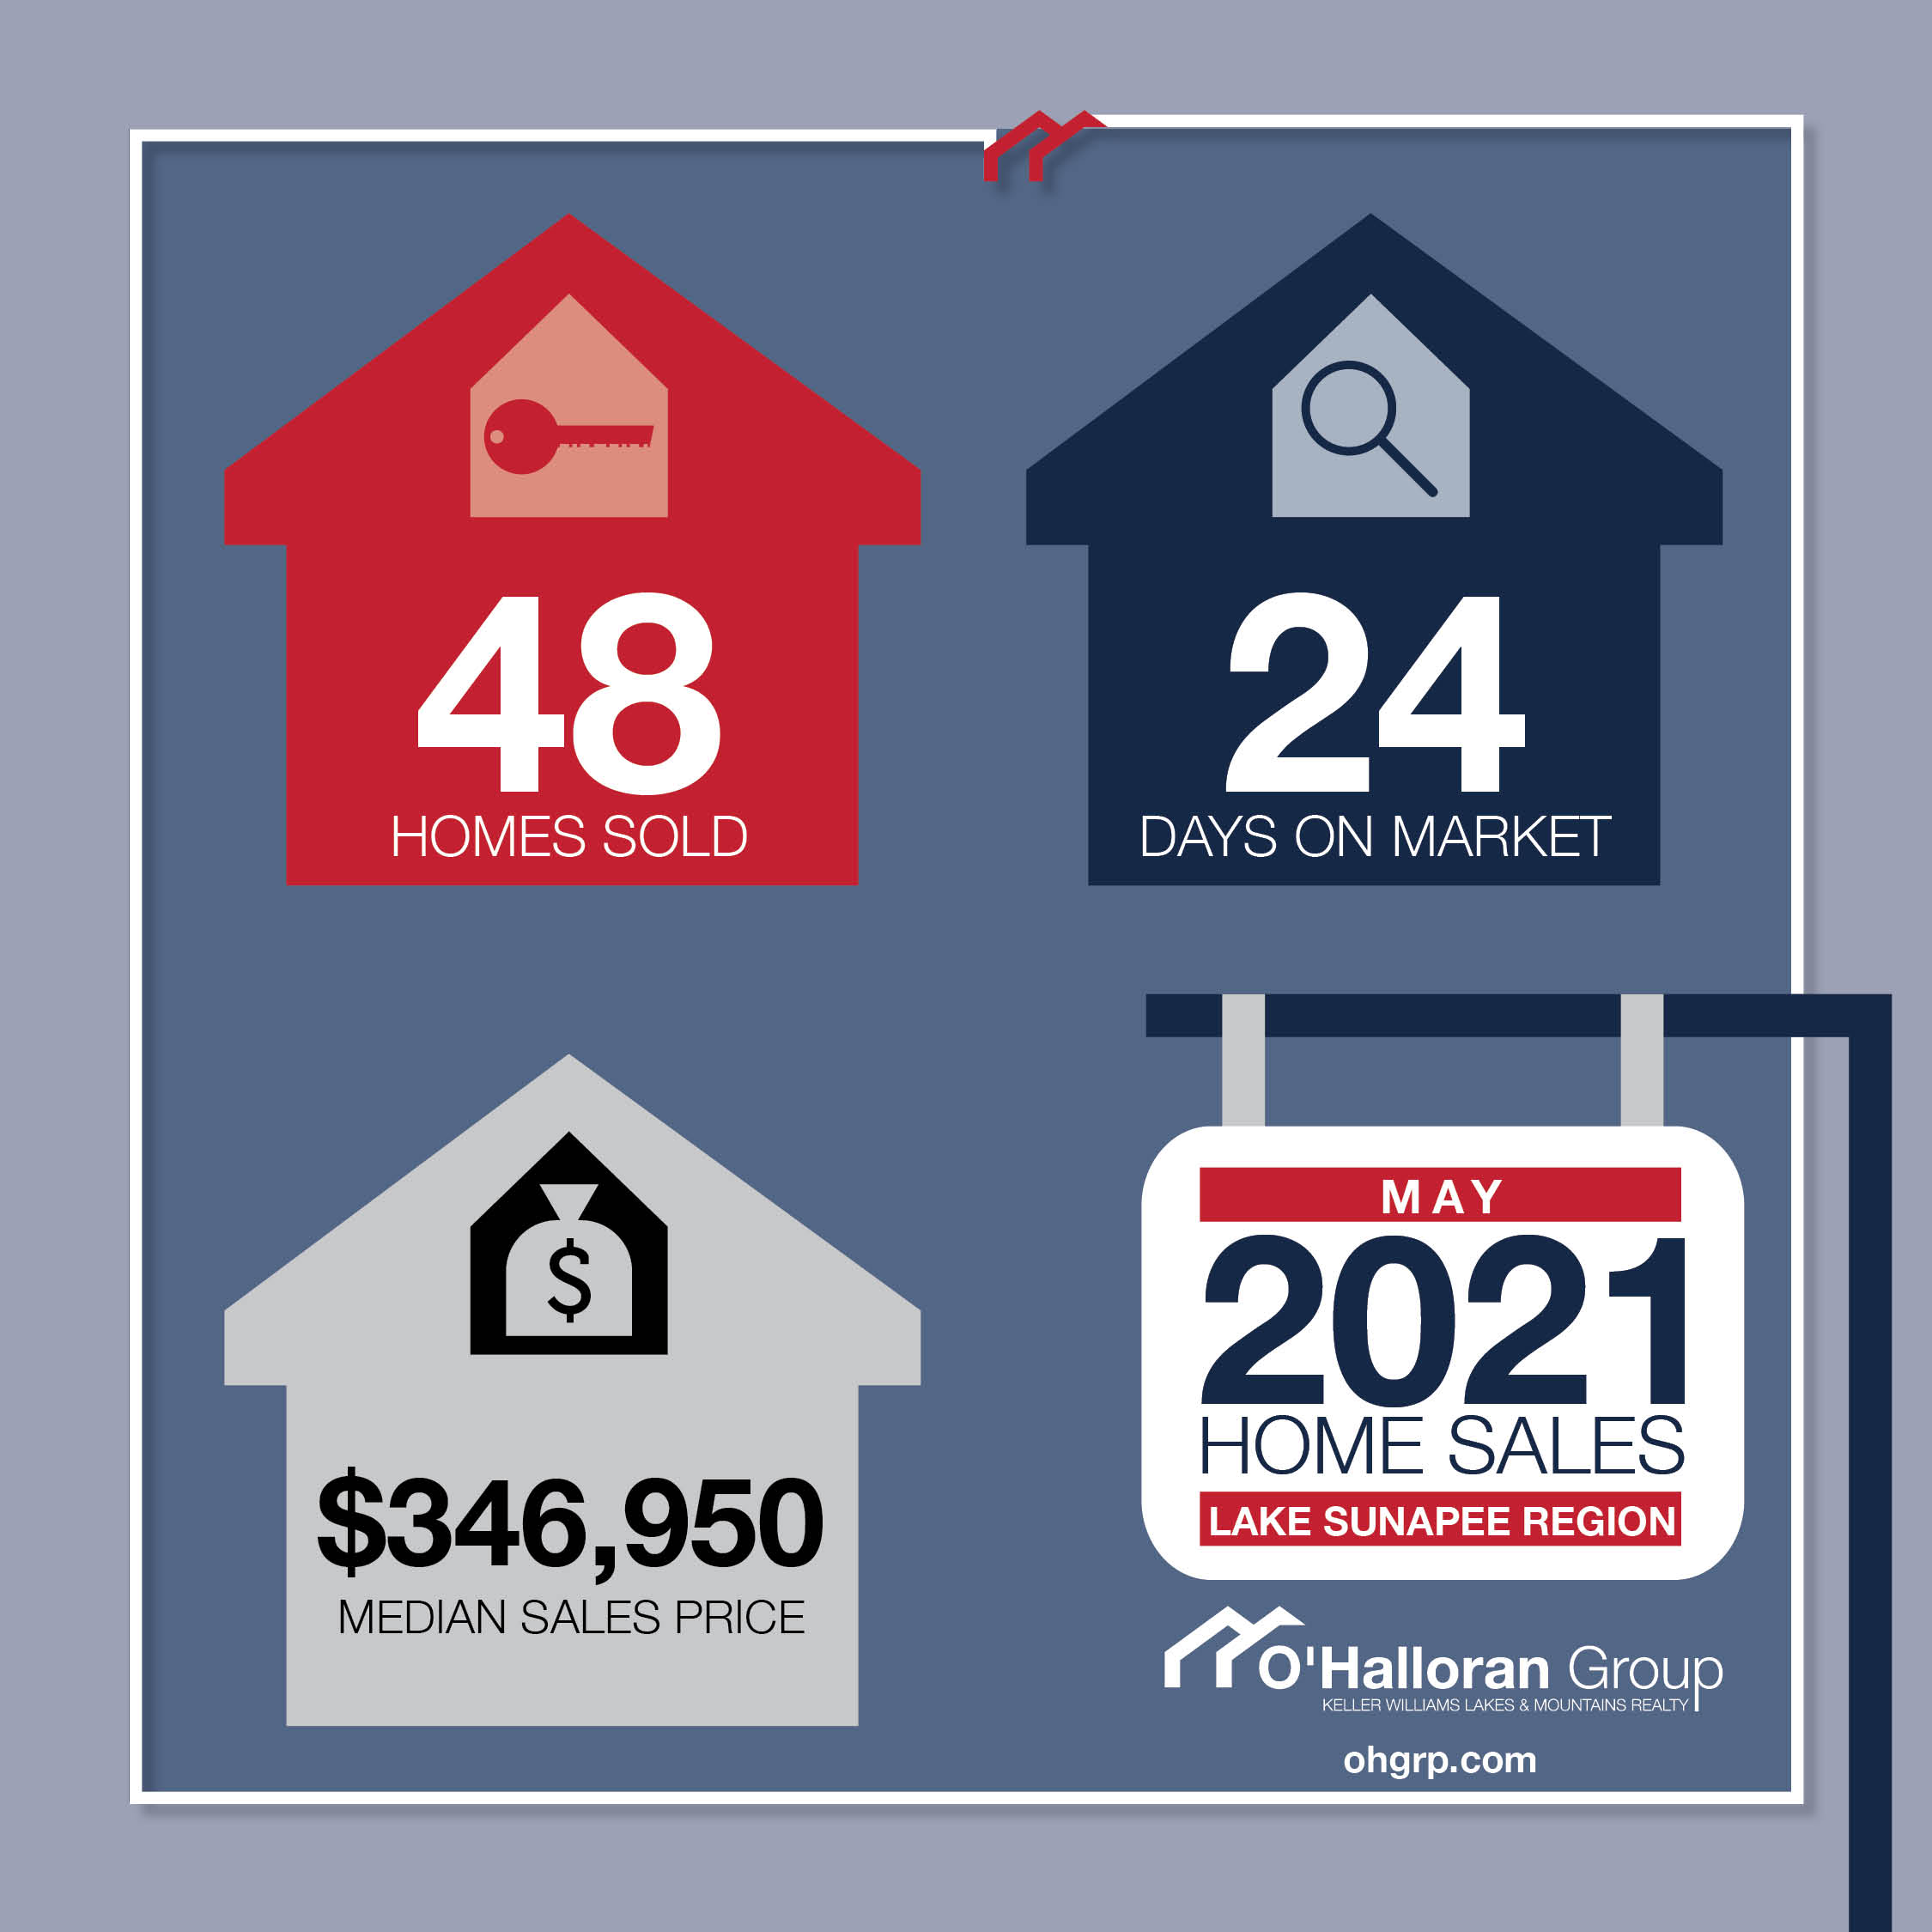
 In this post we take a look at the Sunapee Region real estate market stats for May 2021. The number of home sales and prices have both risen, while the days on the market continues to move quickly. Click here to read more.


In this post we take a look at the Sunapee Region real estate market stats for May 2021. The number of home sales and prices have both risen, while the days on the market continues to move quickly. Click here to read more.
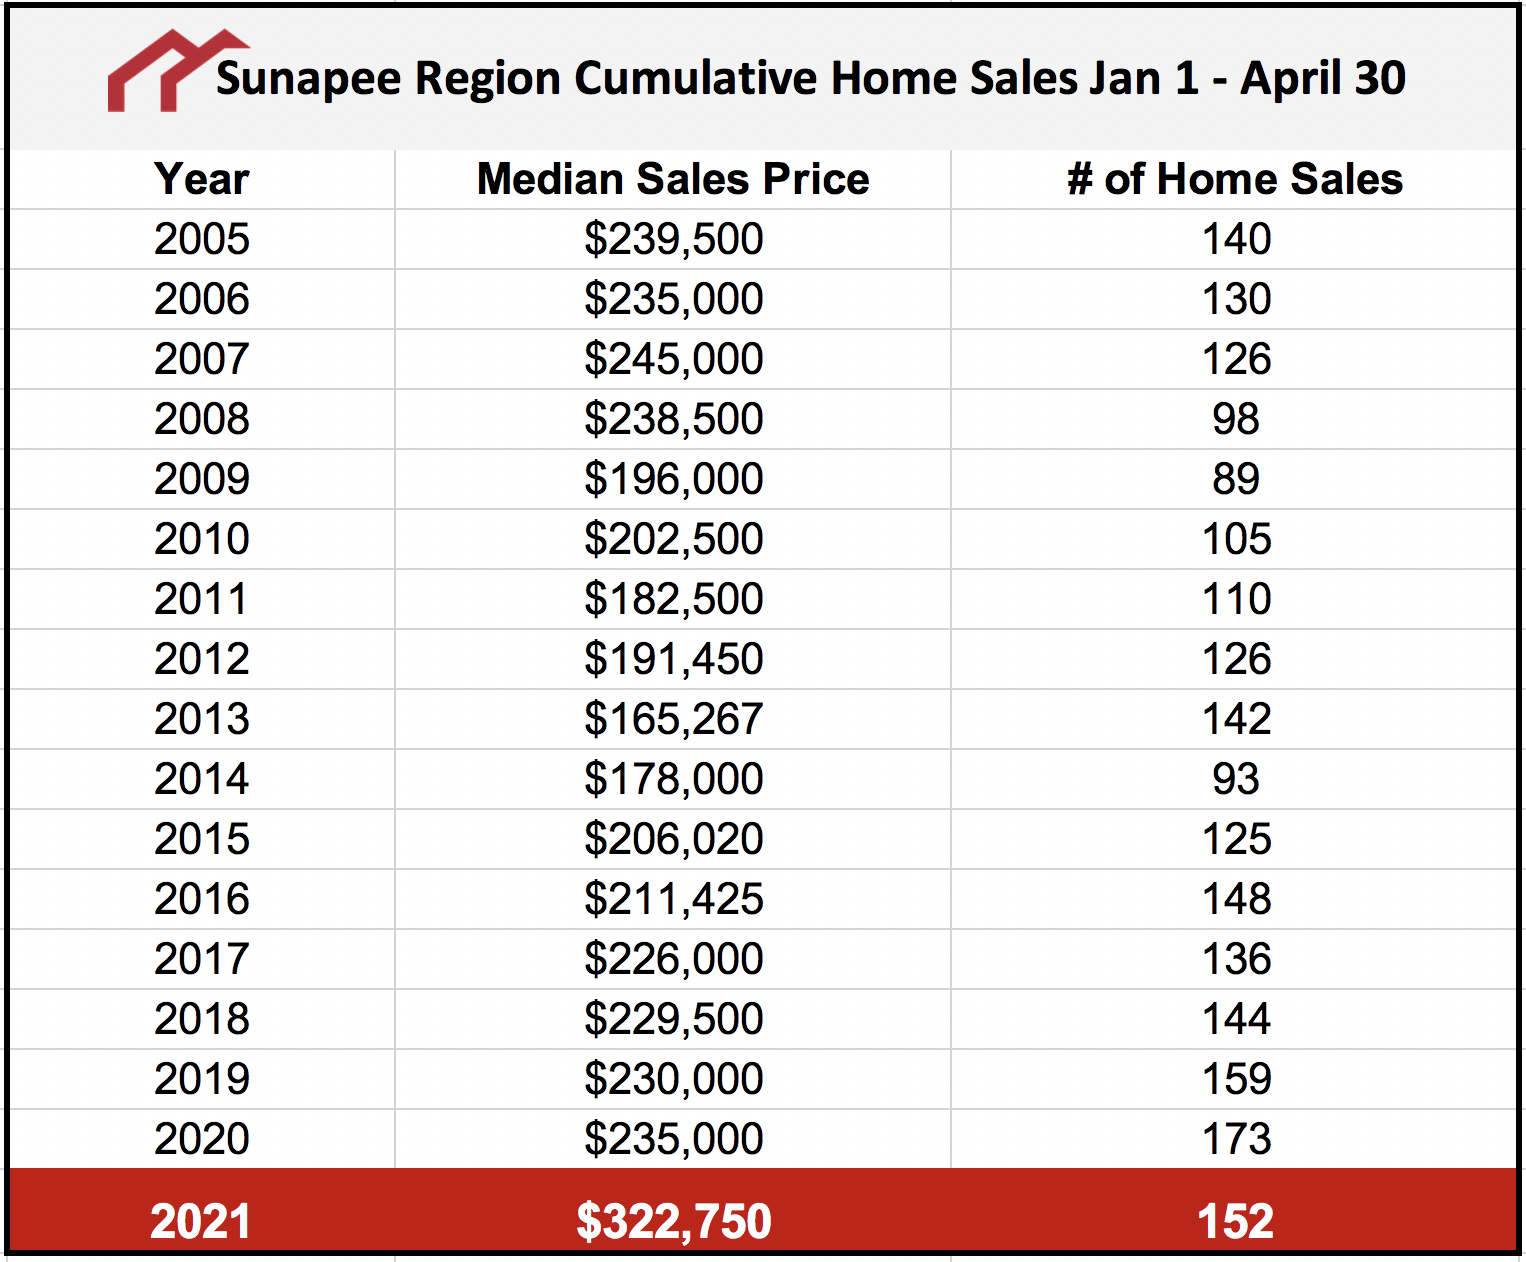
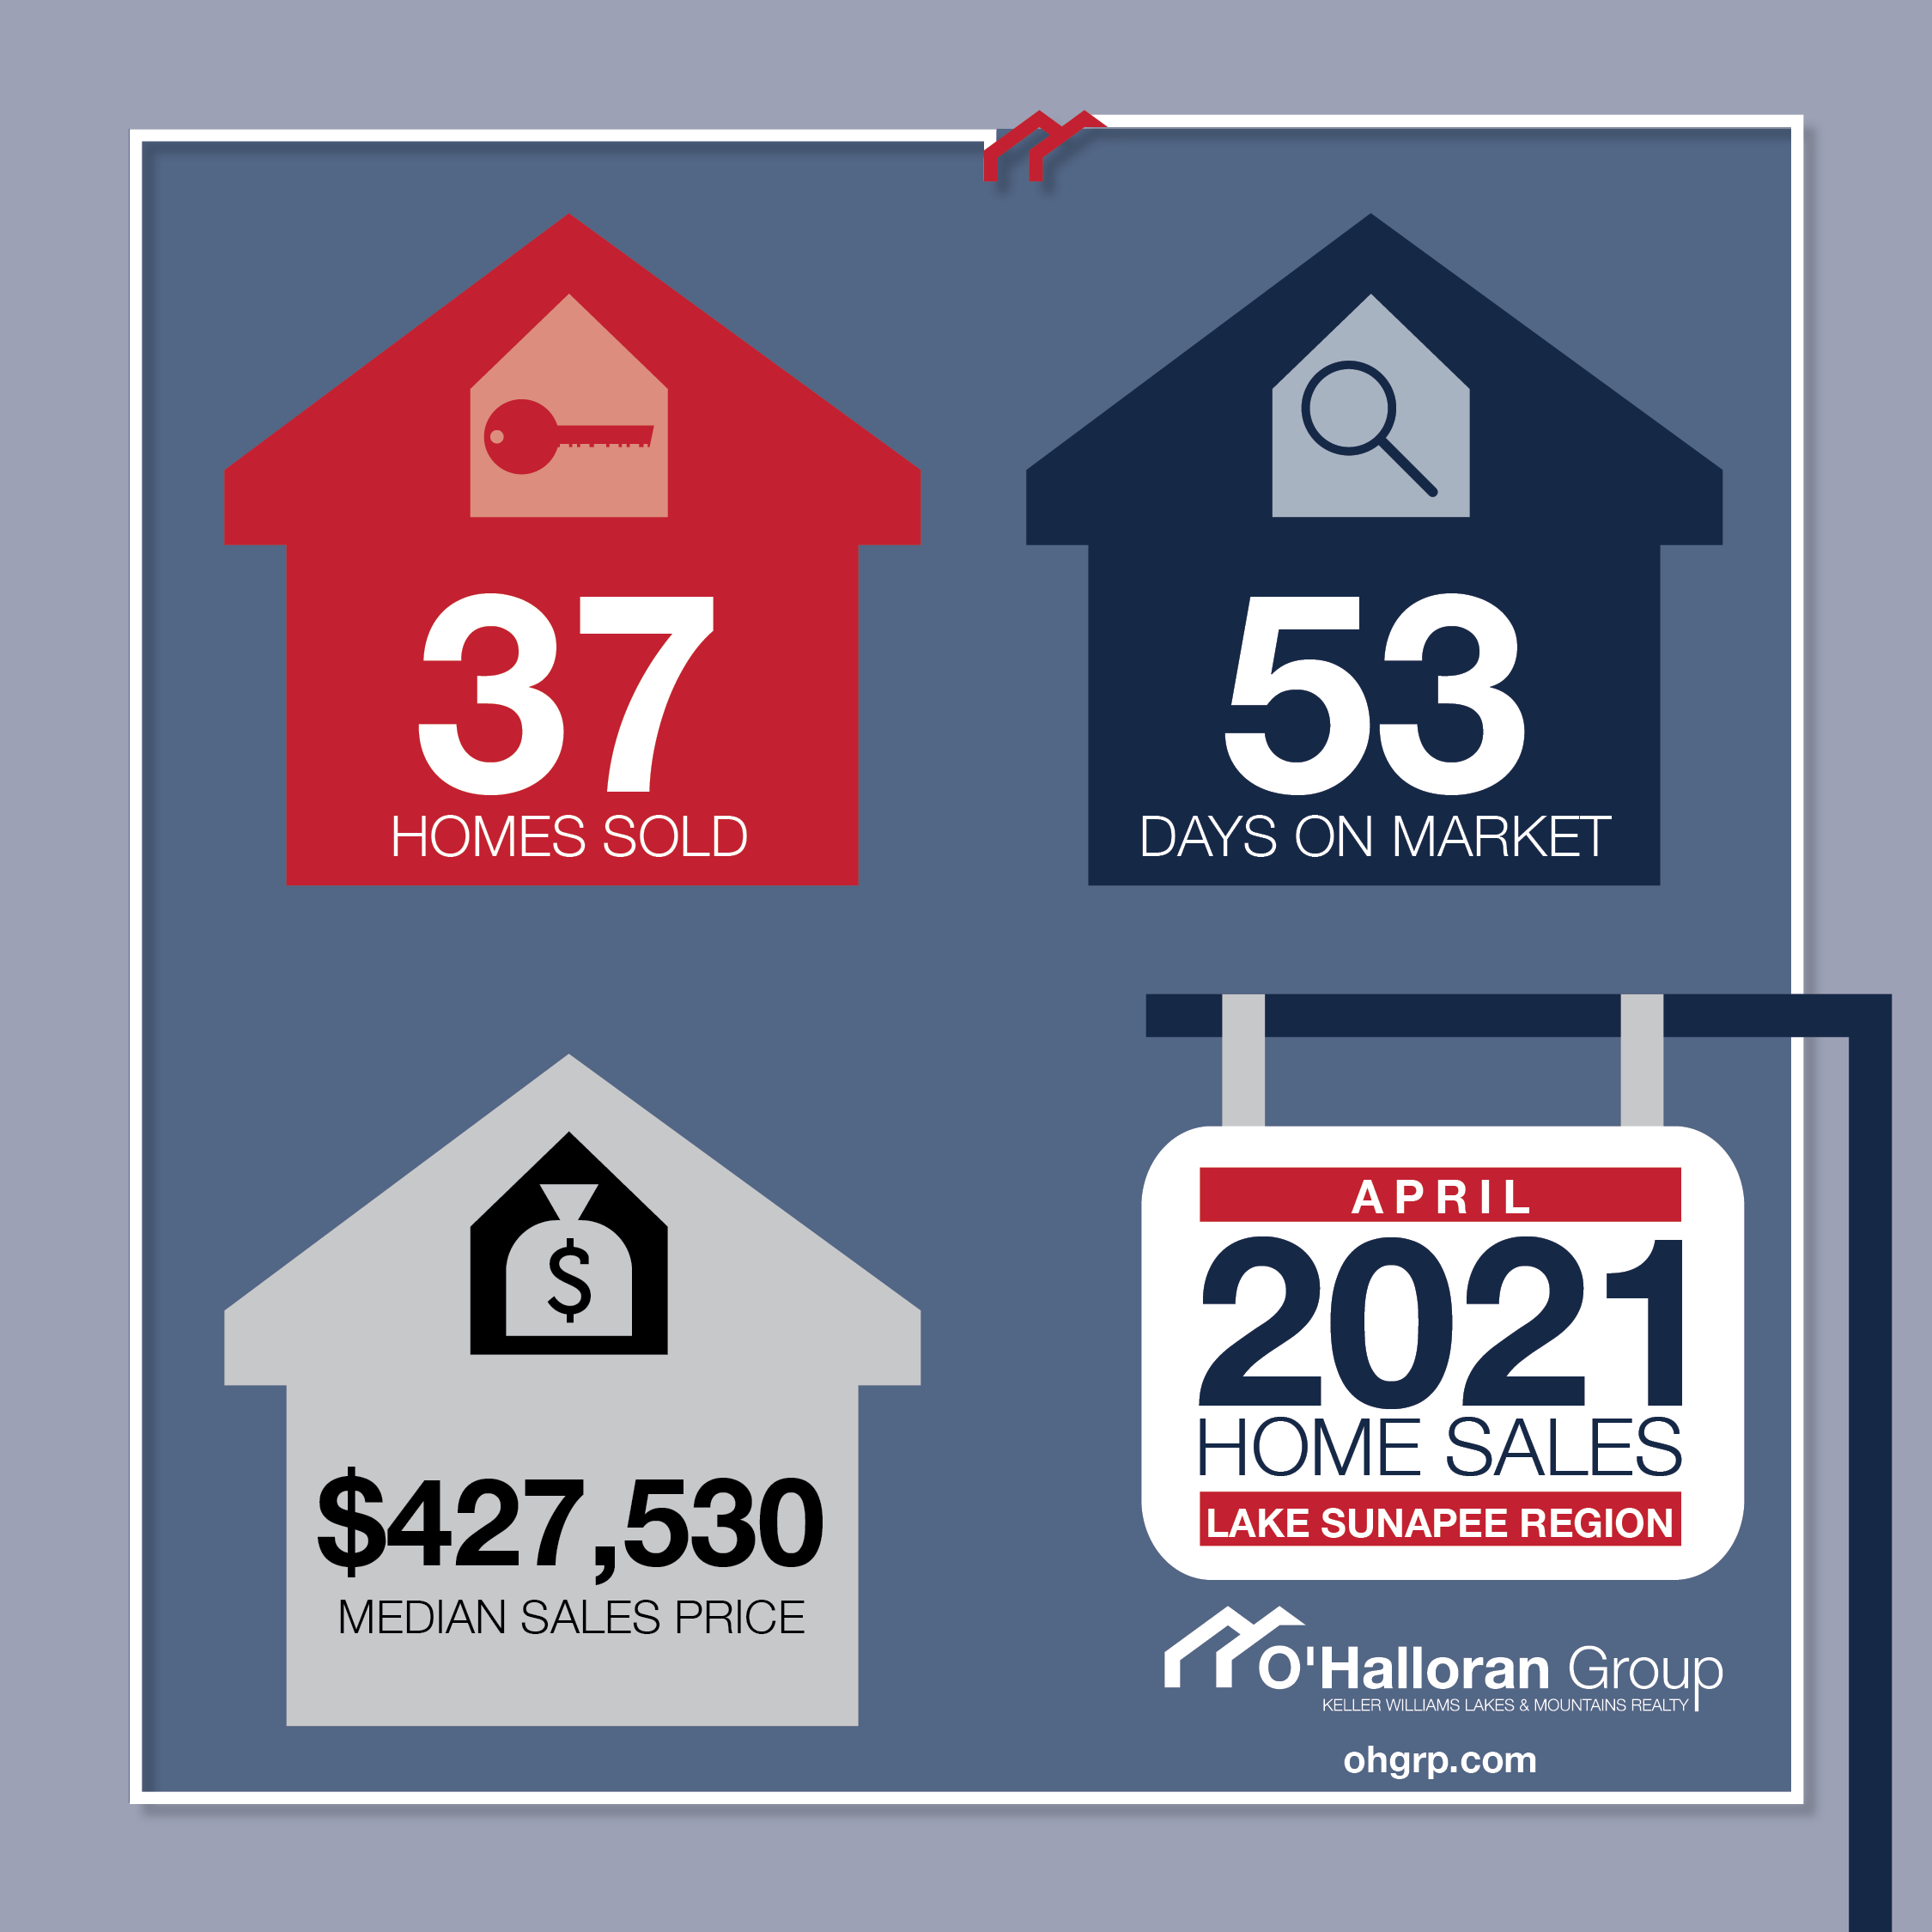 Here's an overview of Sunapee Region home sales during April 2021. There is a continuing trend of fewer home sales in 2021, which April has reinforced, but a median sales price which is trending higher. Click here to read more about April stats.
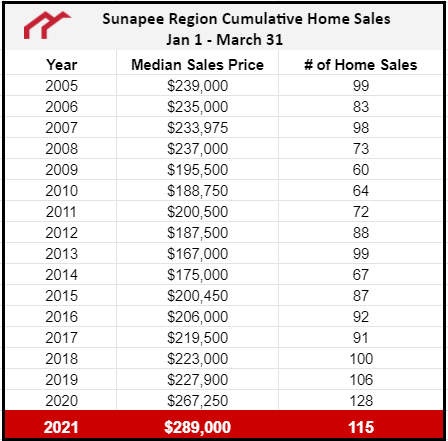
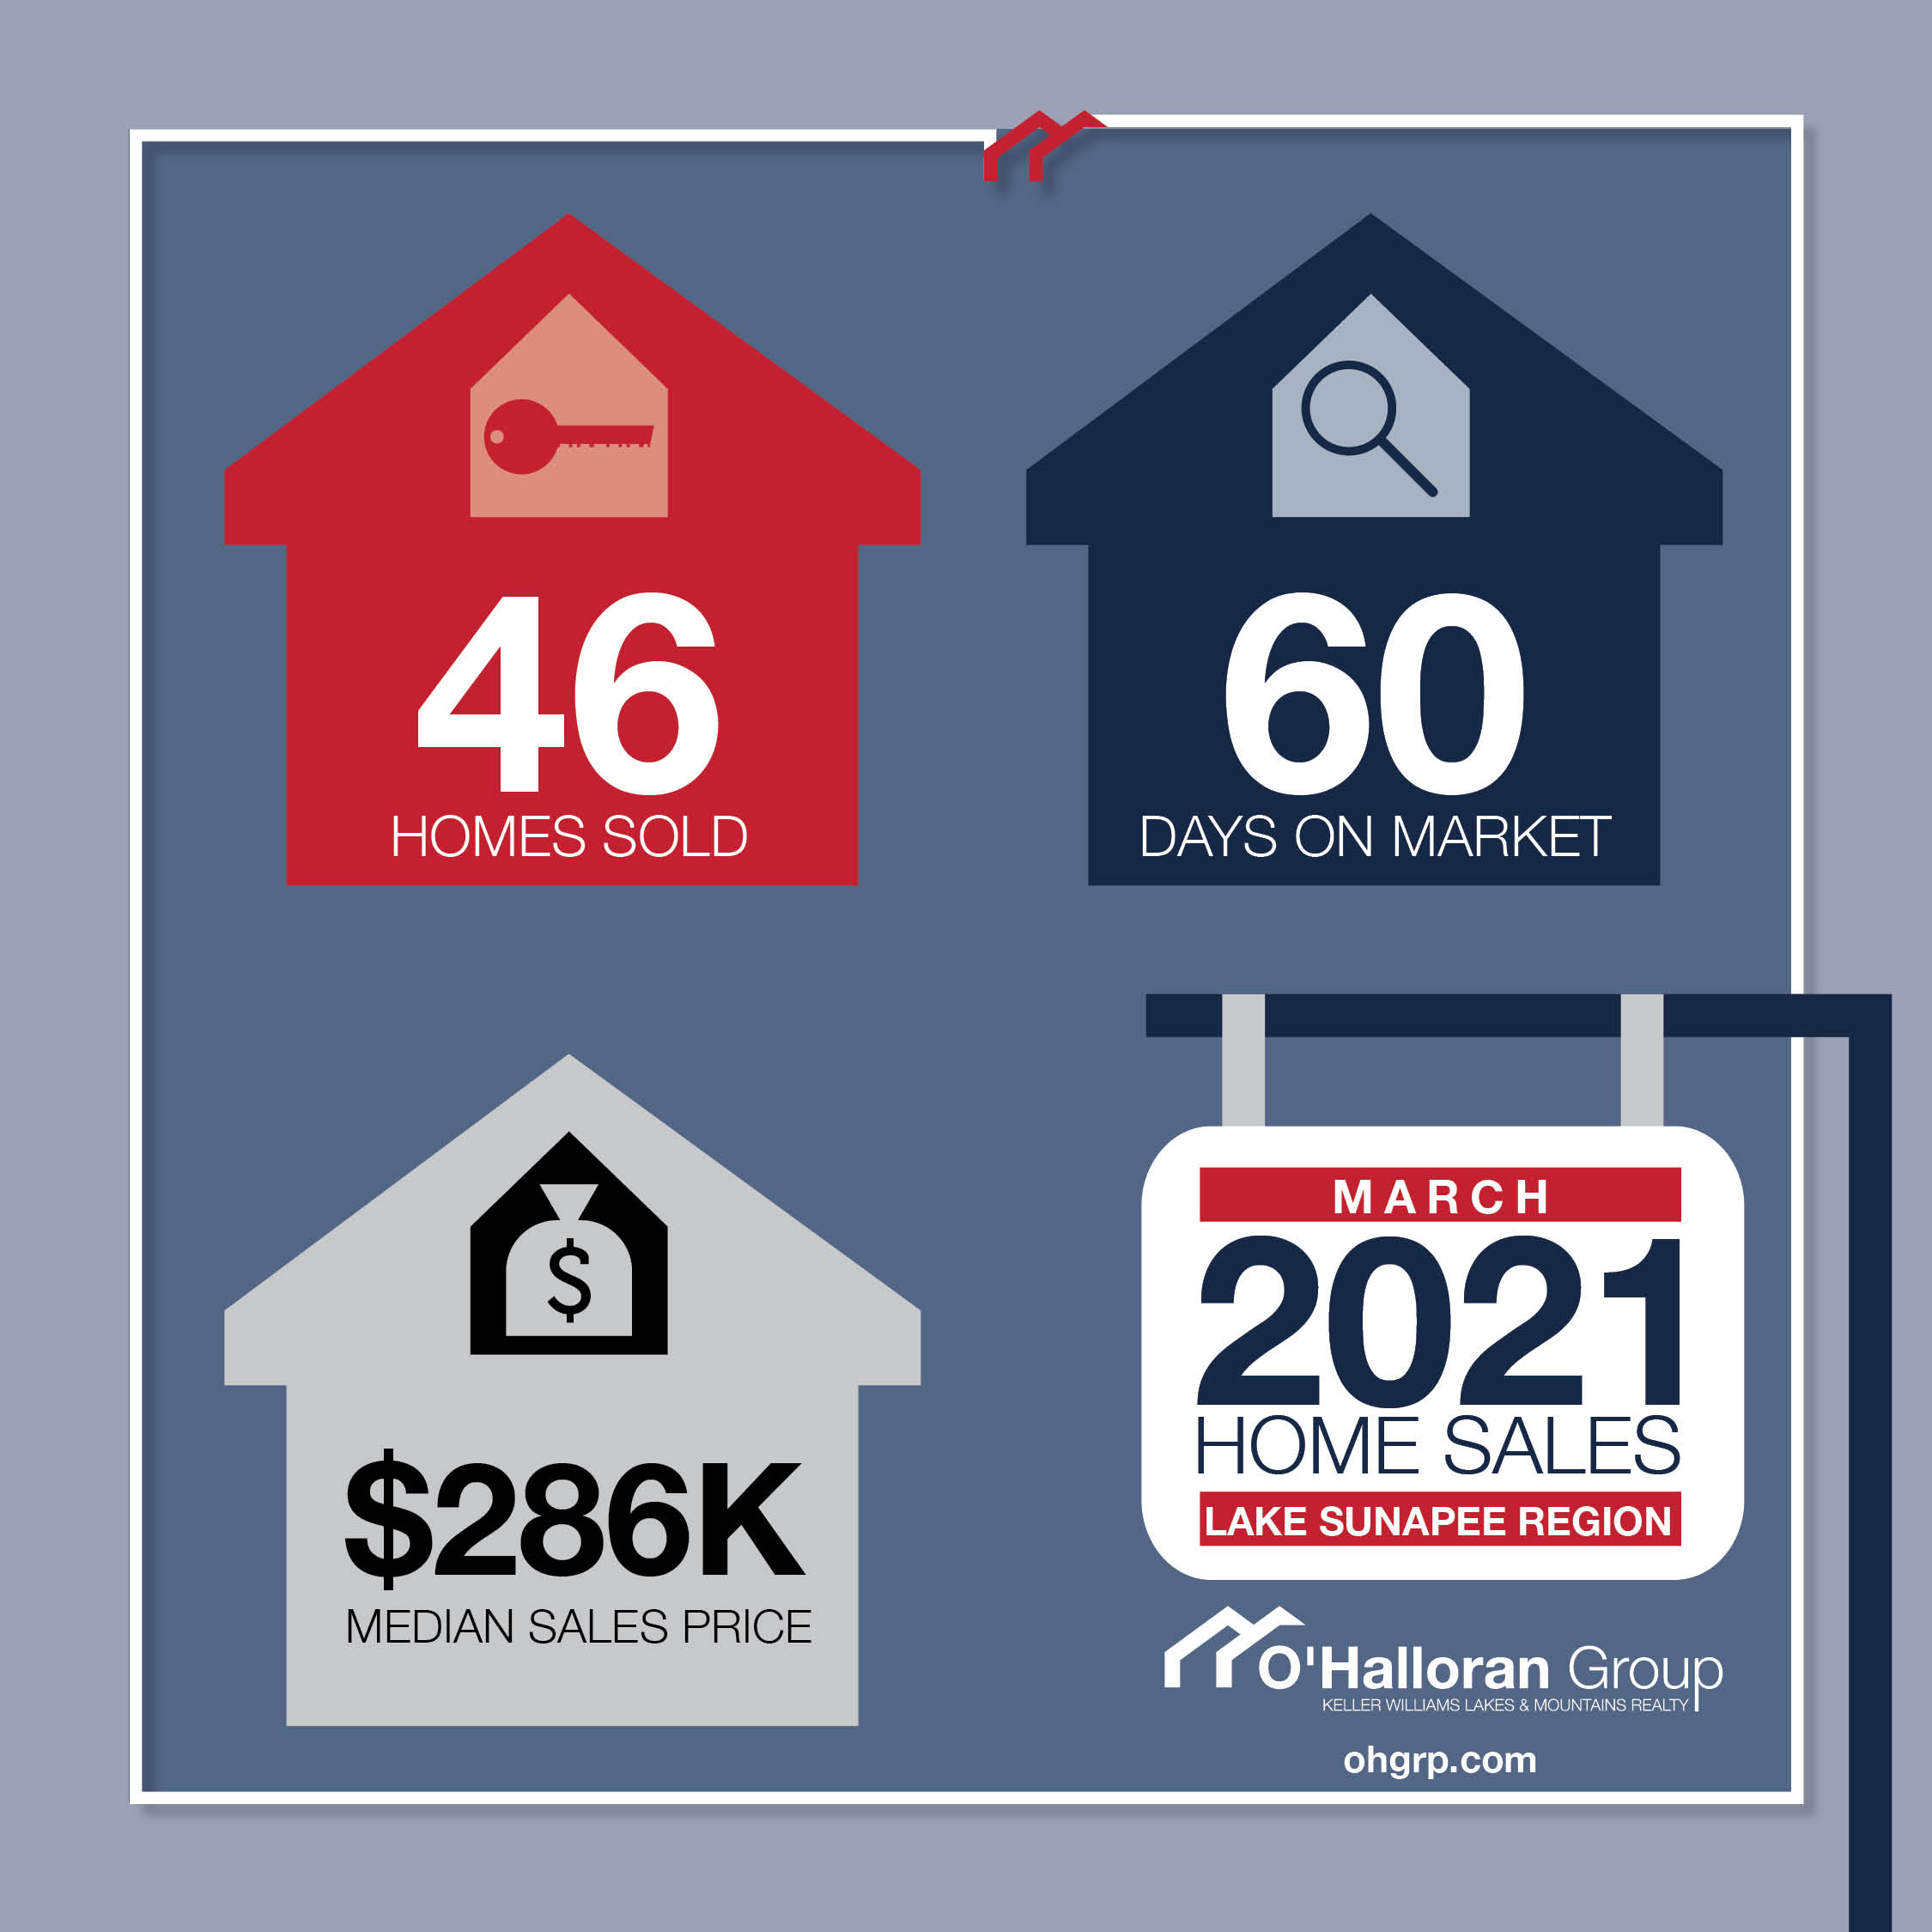
Closing out the first quarter of 2021 Sunapee Region real estate sales, the median sale price continues to exceed previous years, but number of homes sold is lower than past years. This month there was a wide range of sales in Newbury, with a total of 9 homes sold ranging from $75,000-$1,115,000. Read more about March 2021 Home Sales.


February 2021 brought 28 homes sales to the Lake Sunapee region with a year-to-date total of 69 sales. The median sales price continues to rise steadily over previous years and there were 2 sales greater than one million dollars in Sunapee! See how February 2021 compared to historical home sales data.
 January 2021 Home Sales
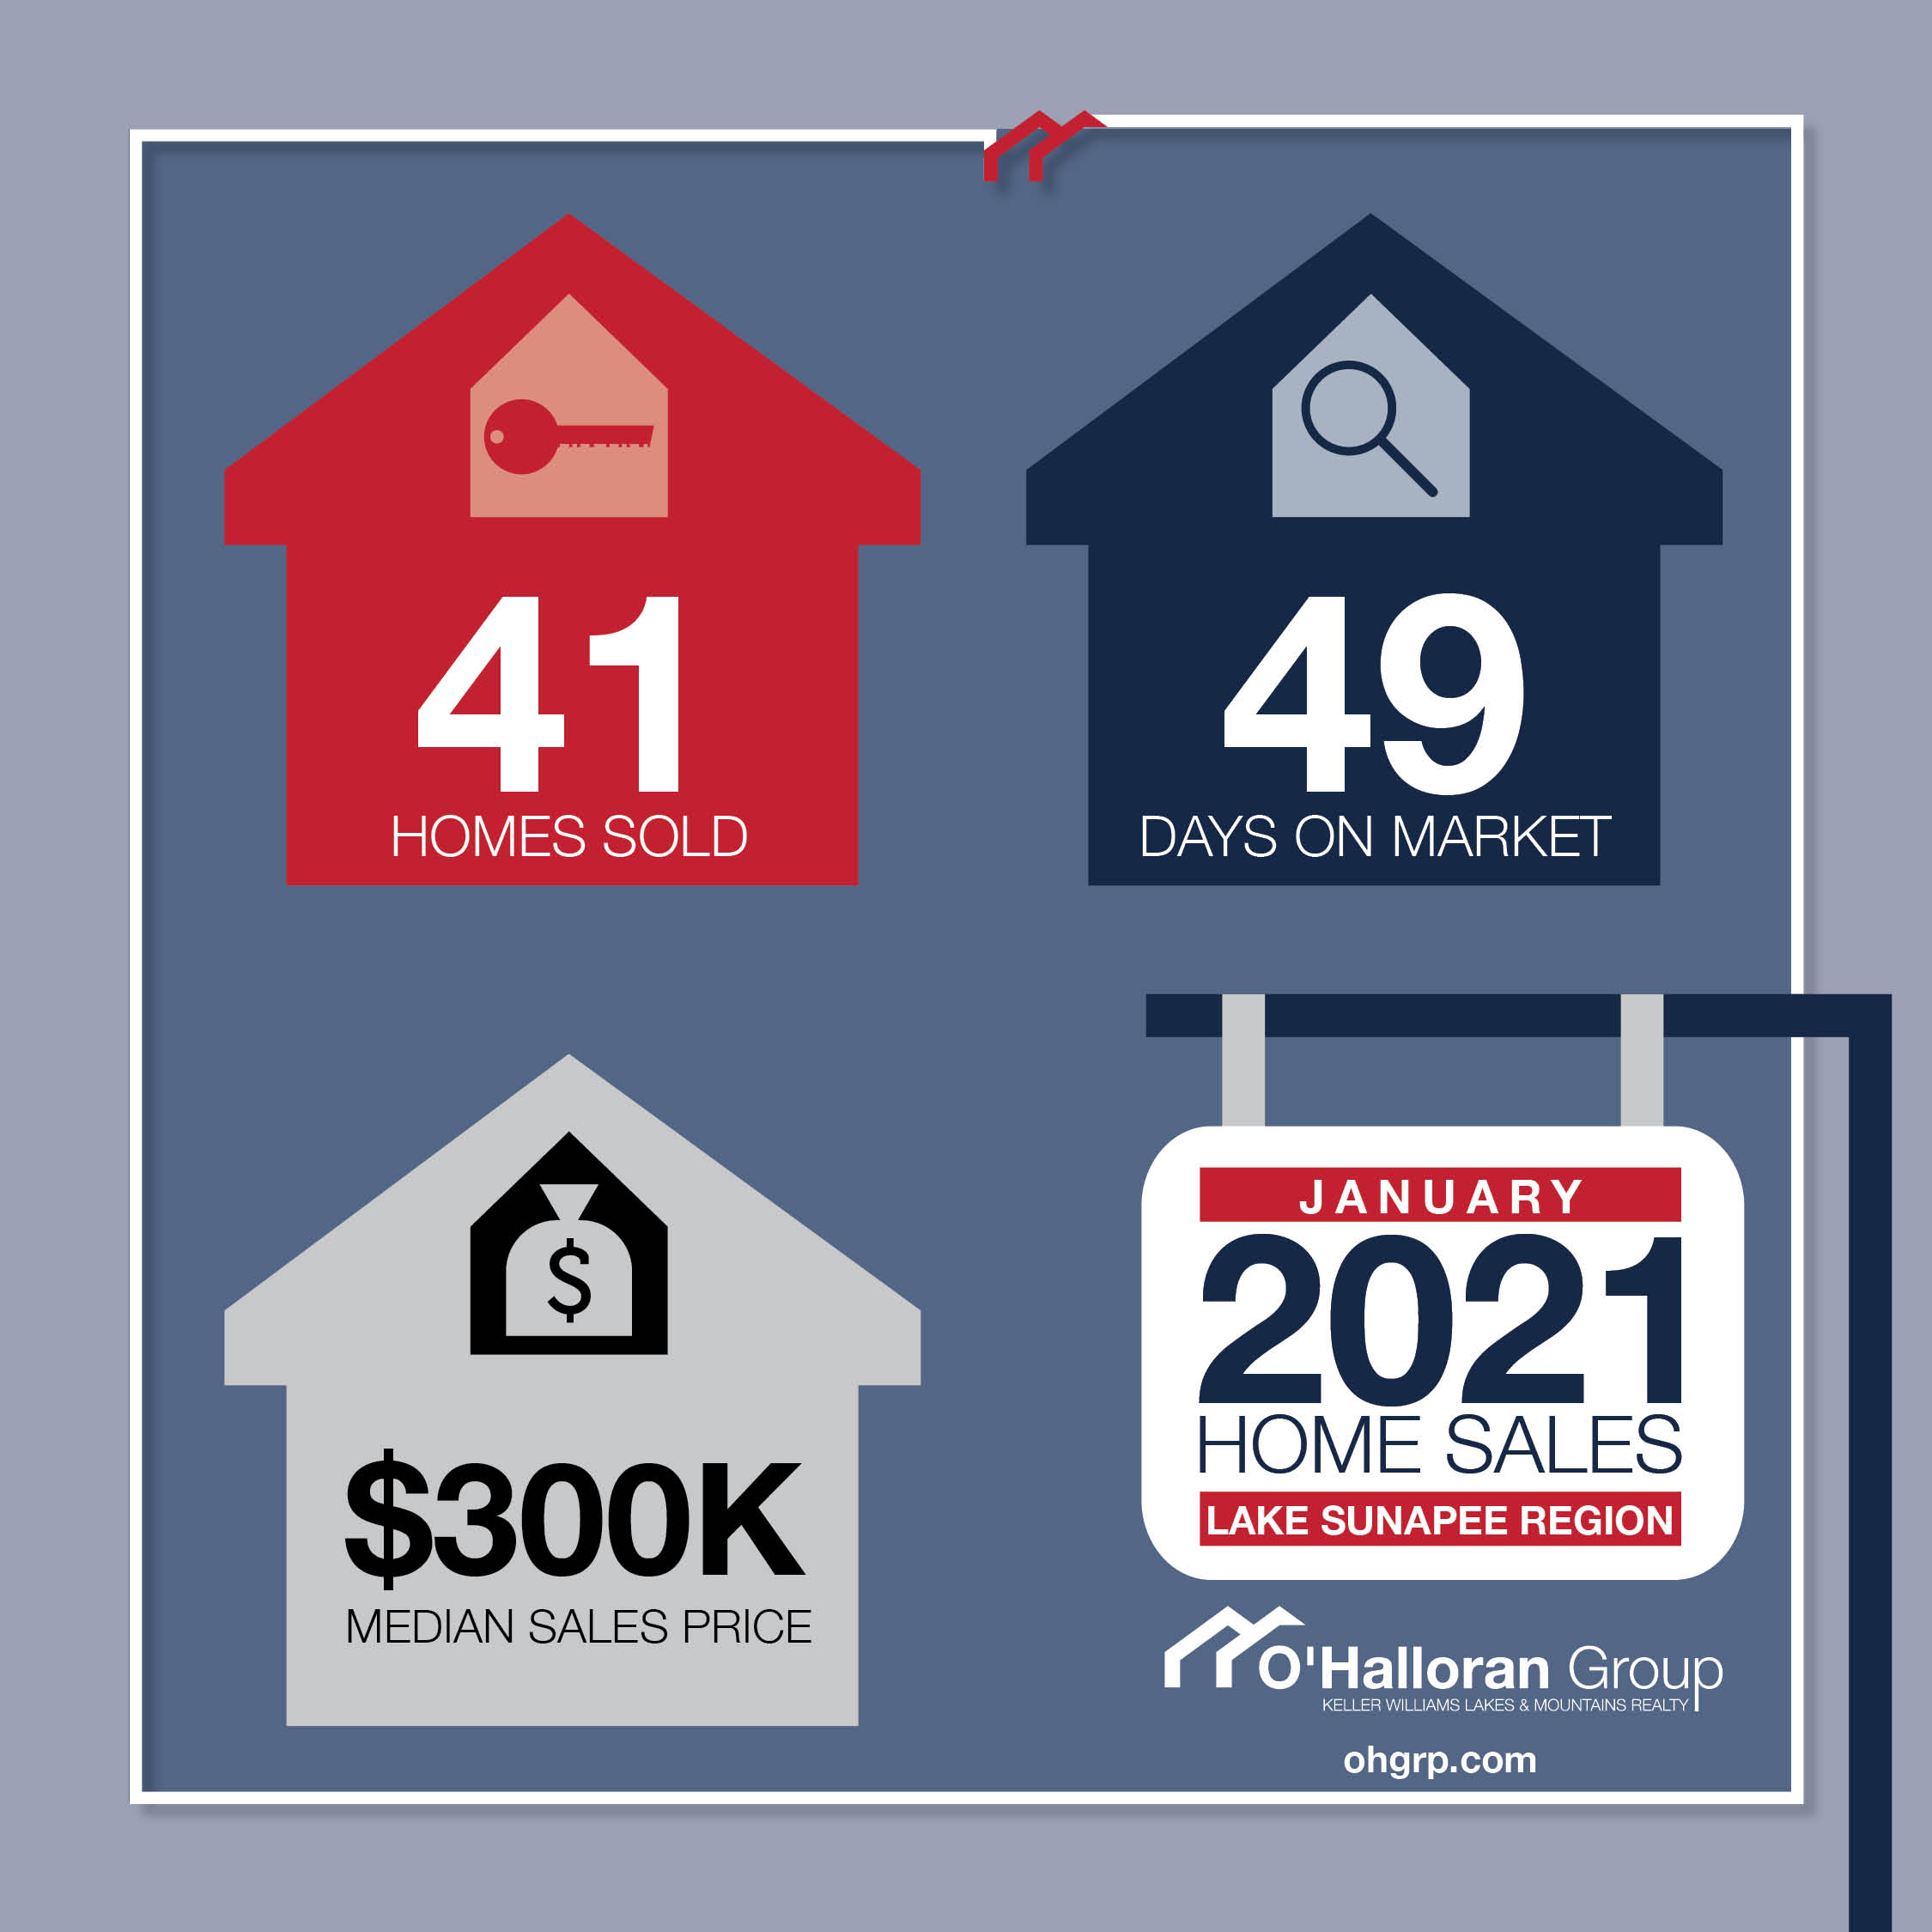
Home sales in the Lake Sunapee Region started off strong for 2021, with a total of 41 sales in January! That is more than the previous record of 40 in 2020. Grantham lead the way with 9 sales, and Newport followed closely with 8. Median sales price is also on the rise--to learn more about January home sales in the Lake Sunapee Region, check out this post.

As we have started 2021 we are looking at the same inventory constraints which were faced in 2020, which means we are likely headed into another busy season of real estate. Median sales prices have continued to increase while homes are selling at a fast pace--learn more about the New Hampshire real estate market and what's going on in the Sunapee Region.

2020 annual real estate sales data for Lake Sunapee Region towns in Sullivan County. See totals home sold by town, sales volume, median sales price and more.

2020 annual real estate sales data for Lake Sunapee Region towns in Merrimack County. See how 2020 home sales by town compare to historical home sales data. You'll find information on number of homes sold by town, total sales volume, median sales price and average days on market information. Click here to view the reports.

 It may come as no surprise but 2020 was a noteworthy year for waterfront home sales on Lake Sunapee. Since the record year of 2014, lakefront home sales have hovered around 20 sales per year until 2020 when 31 properties sold. In comparison to 2014, the median sales price was $225,000 higher and the average was up $431,213 breaking the two million mark. See what properties sold on Lake Sunapee and view historic home sales data.
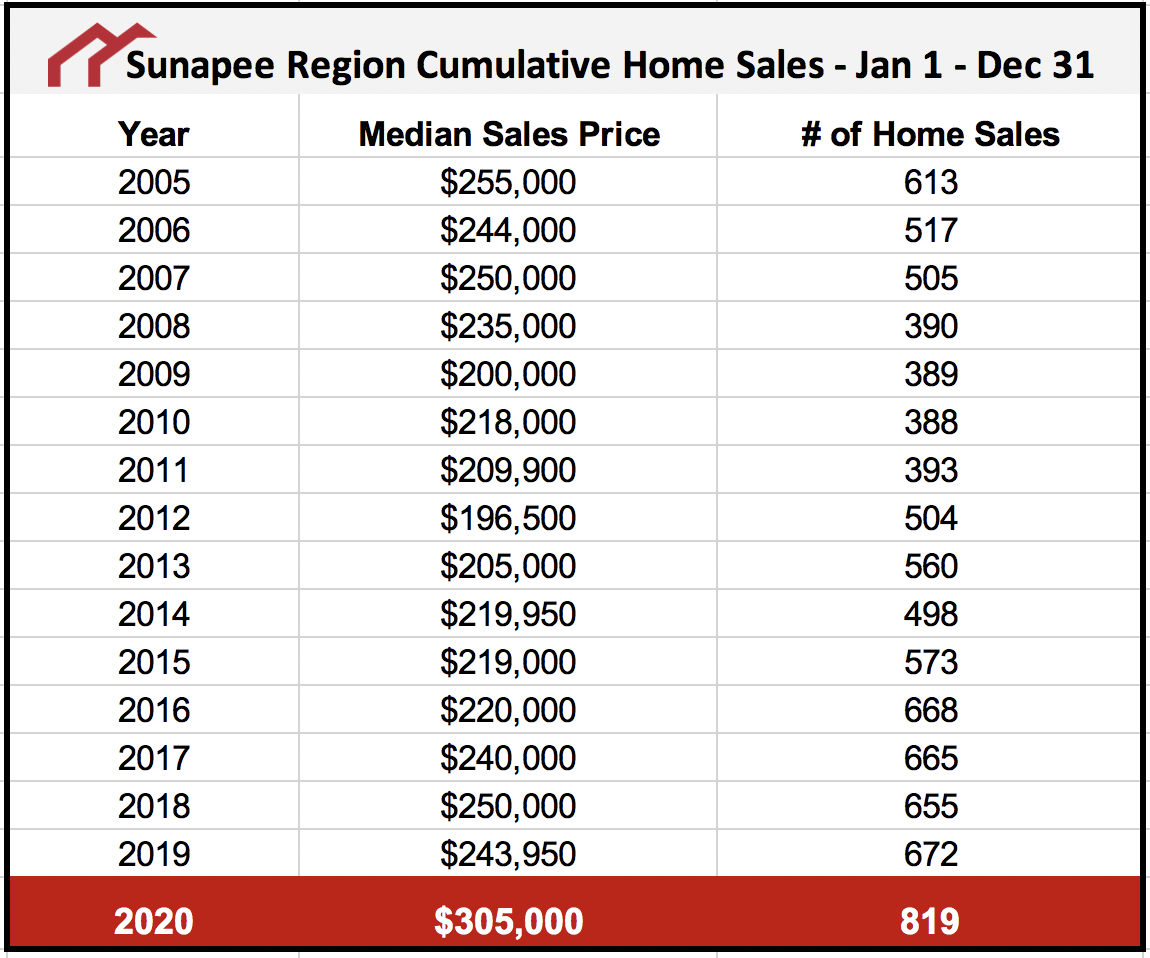
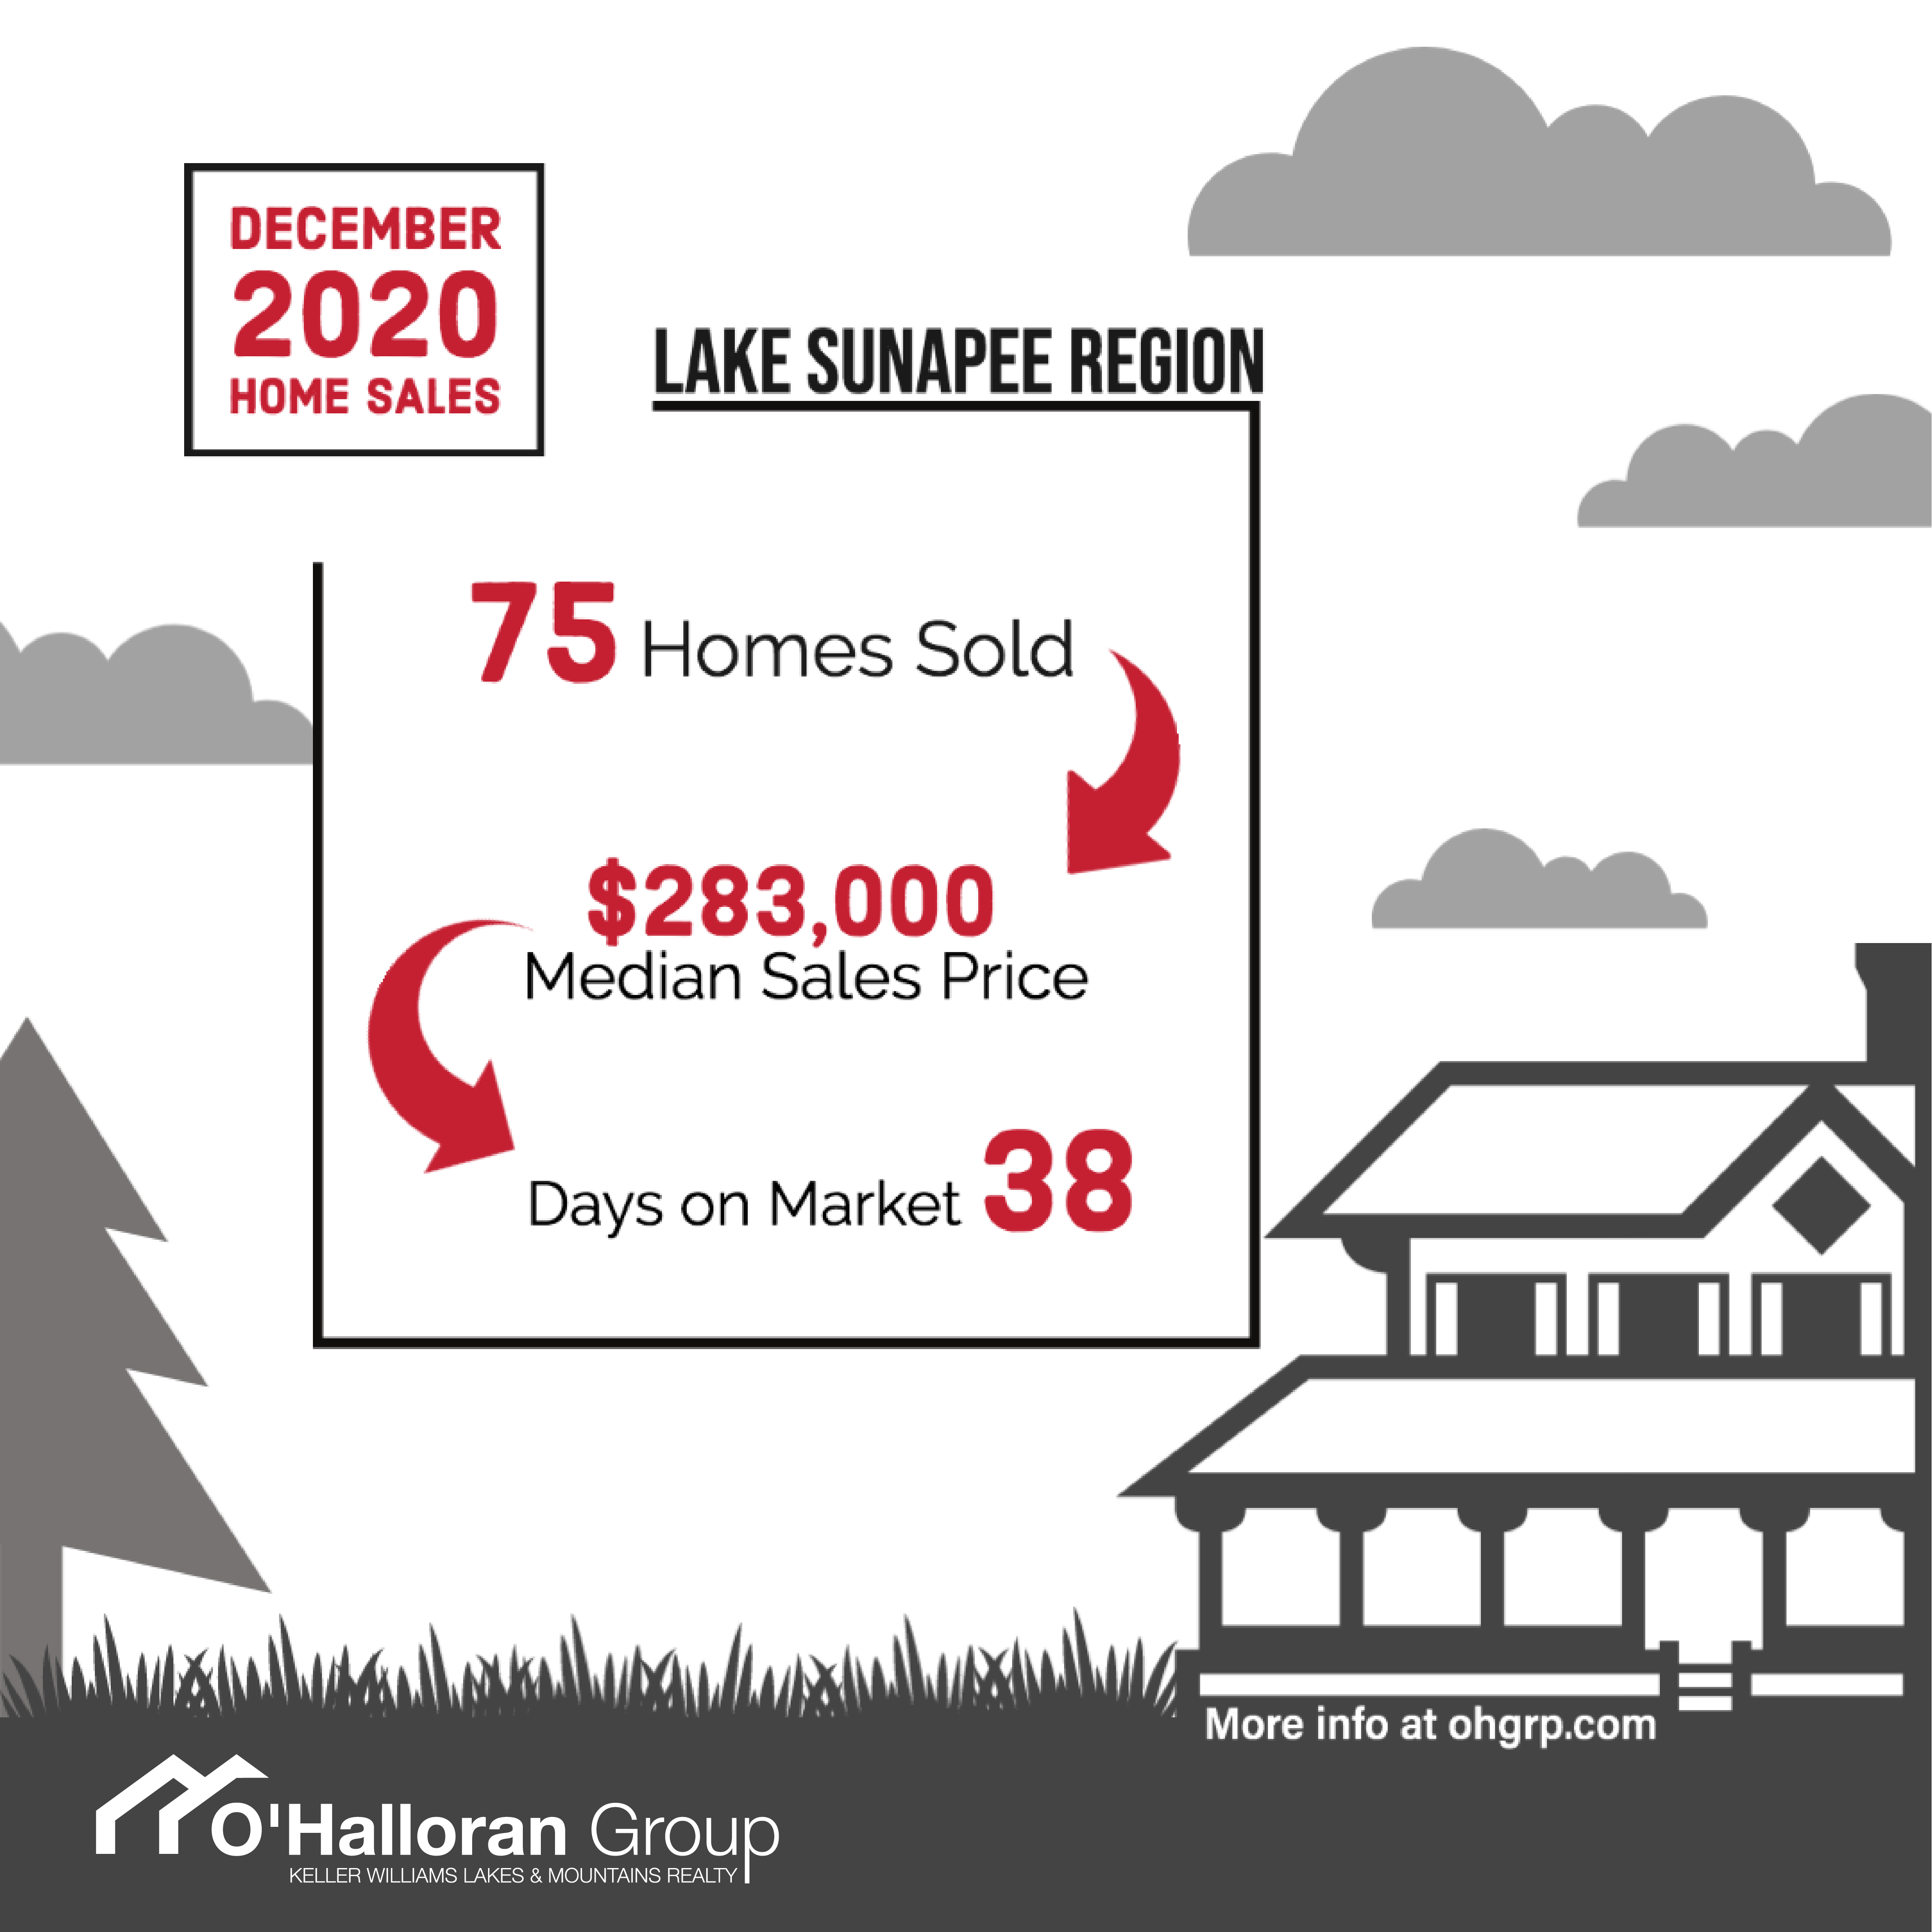 The December numbers are in confirming that the 2020 Sunapee Region real estate market is one for the books! We saw the highest number of single-family homes sold this December since we have been keeping records going all the way back to 2005. The median annual sales price also considerably increased for the region. This post breaks down homes sold by town, what they sold for, and compares December 2020 sales to historical homes sales data for our region. Learn more about real estate in the Sunapee Region.




Social Links